SECURITIES AND EXCHANGE COMMISSION
WASHINGTON, D.C. 20549
SCHEDULE 13E-3
(Amendment No. 2)
RULE 13E-3 TRANSACTION STATEMENT
UNDER SECTION 13(E) OF
THE SECURITIES EXCHANGE ACT OF 1934
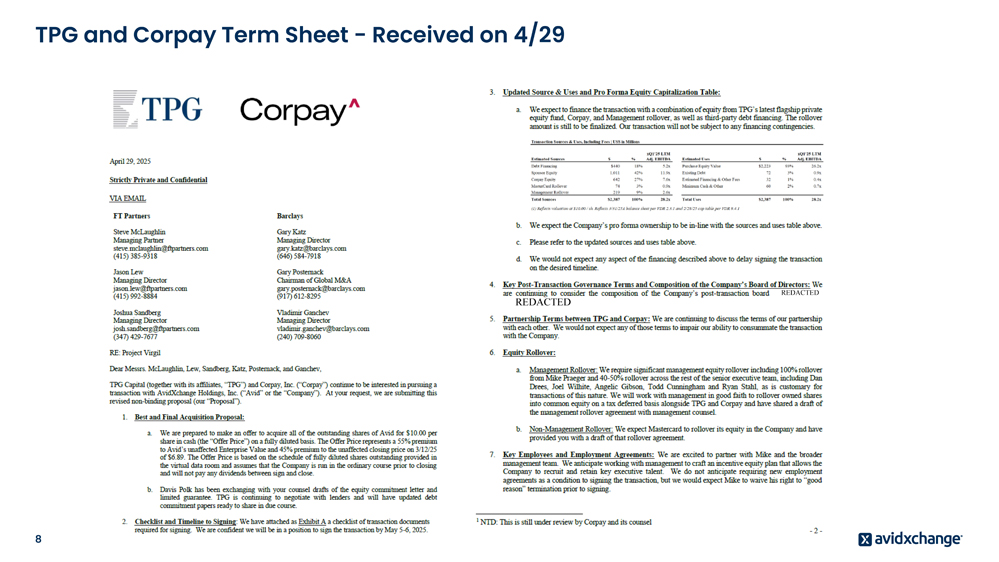
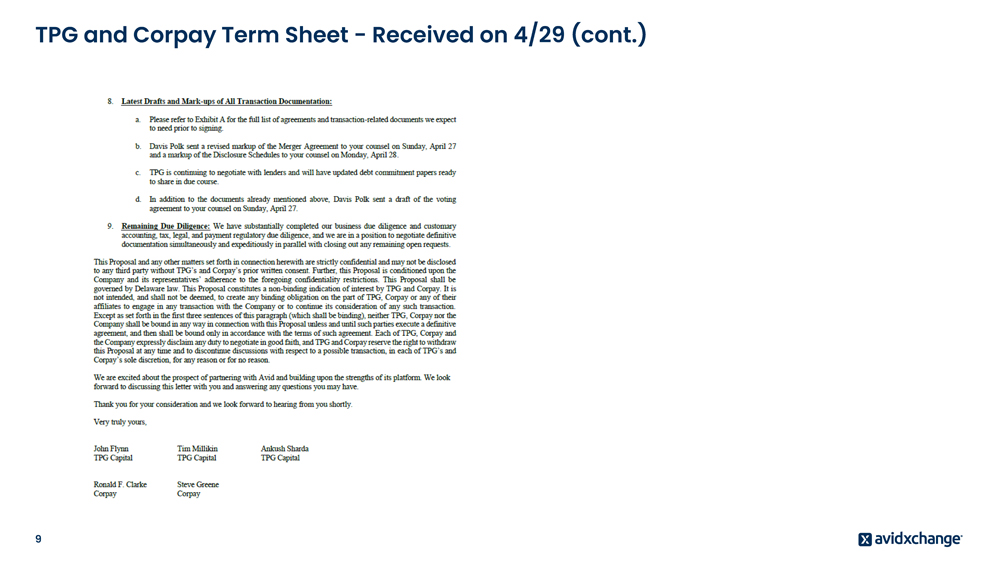
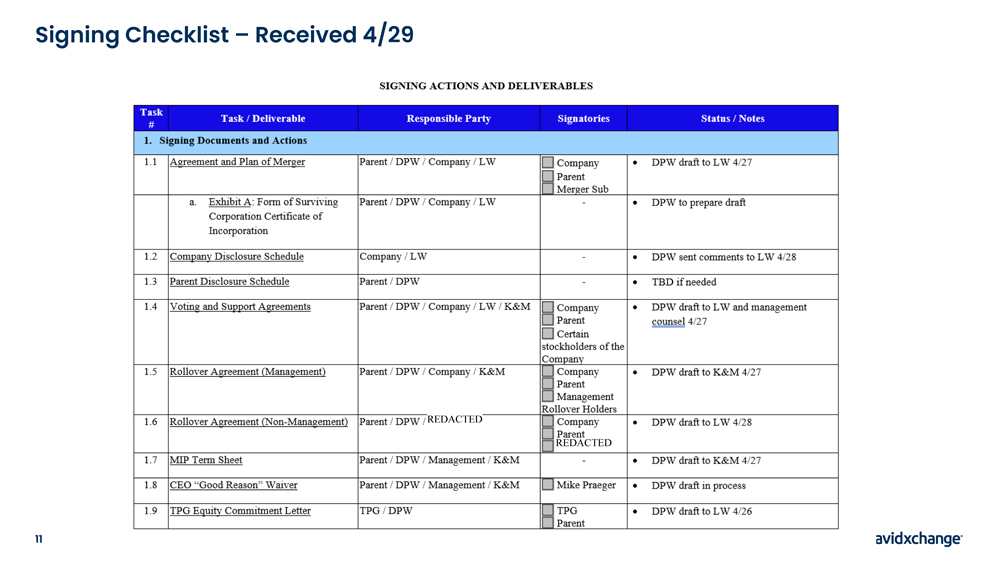
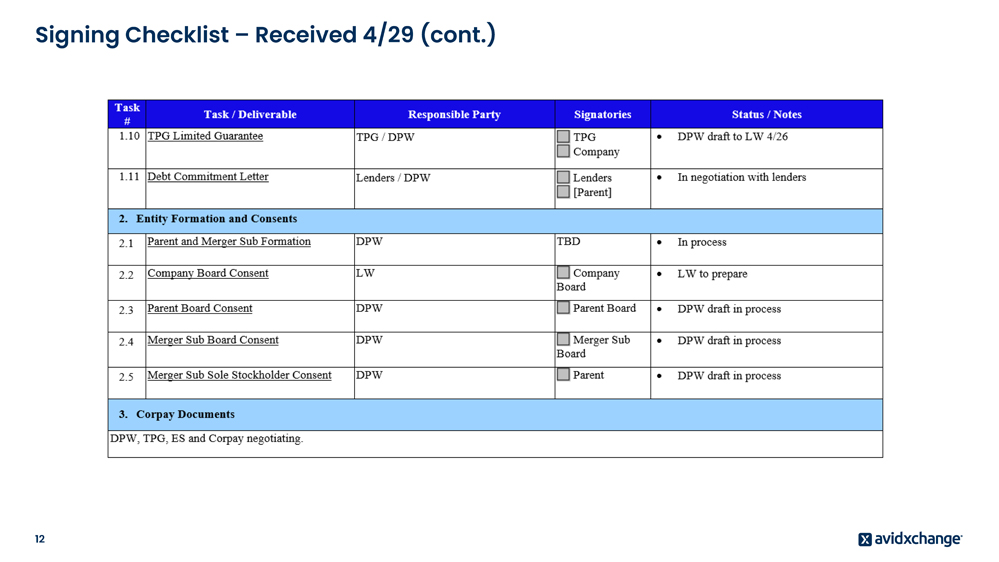
AVIDXCHANGE HOLDINGS, INC.
(Name of the Issuer)
AvidXchange Holdings, Inc.
Arrow Borrower 2025, Inc.
Arrow Merger Sub 2025, Inc.
Arrow Intermediate 2025, Inc.
Arrow Holdings 2025, Inc.
Arrow Parent 2025, L.P.
Arrow Parent GenPar 2025, LLC
TPG IX Arrow Parent Holdings, L.P.
Arrow Parent Holdings GenPar 2025, LLC
The Arrow Holdings Business Trust
TPG Partners IX, L.P.
Corpay, Inc.
Green and Gold 2014 GRAT
Green and Gold 2015 GRAT
Michael Praeger
(Names of Persons Filing Statement)
Common Stock, $0.001 par value per share
(Title of Class of Securities)
05368X102
(CUSIP Number of Class of Securities)
AvidXchange Holdings, Inc. Michael Praeger Green and Gold 2014 GRAT Green and Gold 2015 GRAT c/o AvidXchange Holdings, Inc. Michael Praeger Chief Executive Officer 1210 AvidXchange Lane Charlotte, NC 28206 (800) 560-9305 | Arrow Borrower 2025, Inc. Arrow Merger Sub 2025, Inc. Arrow Intermediate 2025, Inc. Arrow Holdings 2025, Inc. Arrow Parent 2025, L.P. Arrow Parent GenPar 2025, LLC TPG IX Arrow Parent Holdings, L.P. Arrow Parent Holdings GenPar 2025, LLC The Arrow Holdings Business Trust TPG Partners IX, L.P. c/o TPG Partners IX, L.P. 301 Commerce Street, Suite 3300 Fort Worth, TX 76102 (817) 871-4000 | Corpay, Inc. Alissa Vickery Chief Financial Officer 3280 Peachtree Road, Suite 2400 Atlanta, GA 30305 (770) 449-0479 | ||||
(Name, Address, and Telephone Numbers of Person Authorized to Receive Notices
and Communications on Behalf of the Persons Filing Statement)
With copies to
David Beller Ian Nussbaum Cathy Birkeland Latham & Watkins LLP 1271 Avenue of the Americas New York, NY 10020 (212) 906-1200 | Oliver Smith Darren Schweiger Michael Diz Davis Polk & Wardwell LLP 450 Lexington Avenue New York, NY 10017 (212) 450-4000 | ||
This statement is filed in connection with (check the appropriate box):
a. | ☒ | The filing of solicitation materials or an information statement subject to Regulation 14A, Regulation 14C or Rule 13e-3(c) under the Securities Exchange Act of 1934. | ||||
b. | ☐ | The filing of a registration statement under the Securities Act of 1933. | ||||
c. | ☐ | A tender offer. | ||||
d. | ☐ | None of the above. | ||||
Check the following box if the soliciting materials or information statement referred to in checking box (a) are preliminary copies: ☒
Check the following box if the filing is a final amendment reporting the results of the transaction: ☐
Neither the Securities and Exchange Commission nor any state securities commission has approved or disapproved of this transaction, passed upon the merits or fairness of this transaction or passed upon the adequacy or accuracy of the disclosure in this transaction statement on Schedule 13E-3. Any representation to the contrary is a criminal offense.